Last Months Review
The daily predictions are being placed in the Facebook pages. This is followed by a review of the real market to the signals. Overall the results were very good, for both planetary and geomagnetic correlations. Over 60 updates were made. There is now a stable system in place, which is systematic and structured, but more importantly intuitive. It is totally independent of the market and yet there is a correlation. In fact it is the market that correlates to the signals, as opposed to the signals correlating to the market, as is the case with any other prediction model.
General Guide
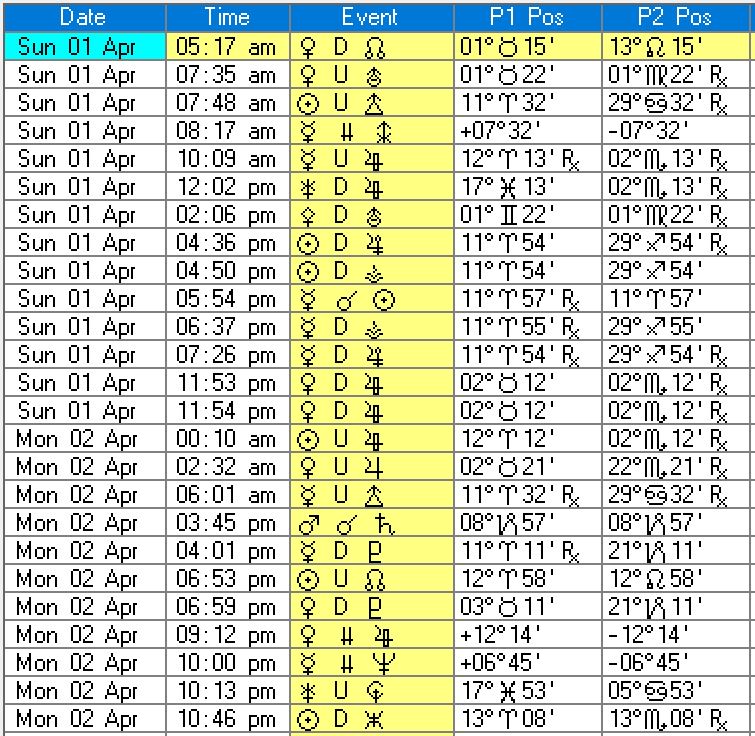
This is a home grown system. 40 years of my life. The movements of the planets to each other, is measured, using my own set of angles, that are then simplified into U's and D's, and symbols for parallel and contra-parallels. To begin with, I compare the angles of Mars, then it is the faster planets. Faster planets' angles change quite a lot, so we have to see if there are moments when there is a focus of aspects. Mars background aspect is used, if there are no faster planets' aspects. These are drawn in colour in the Facebook comments. General comments are placed here. They are not definitive. The Geomagnetic activity has to be used as described in the Facebook page. I have put summaries under each table, for US trading, for Mars and faster planets. Times are GMT.
Mars Table
How to use the Mars table
Just look at the Mars angles, and find the moment your are in. If you see that the next aspect from the time you are looking at is a U, then the markets will be seen in positive mood, and negative if it is a D. It is strong when it is within one degree. You will see a thick red or green at the Facebook comment.


Faster Planets Summary
I have looked at the 01:30 pm to 08:00 pm GMT periods for Monday to Friday values, as they are US trading times. As you can see some of them are in bold. There are more D's in bold. That means the down pressures are more. See the Mars table and you can see how strong it could be.
Neptune Tables
Moon and other planets and Sun aspects to Neptune correlate to Oil and other commodities. They have been illusive, as they should, because Neptune is. Nowadays Oil does correlate more to normal planetary aspects above, than to just Neptune. This area of my work is still a work in progress. But it looks like Oil will fall.


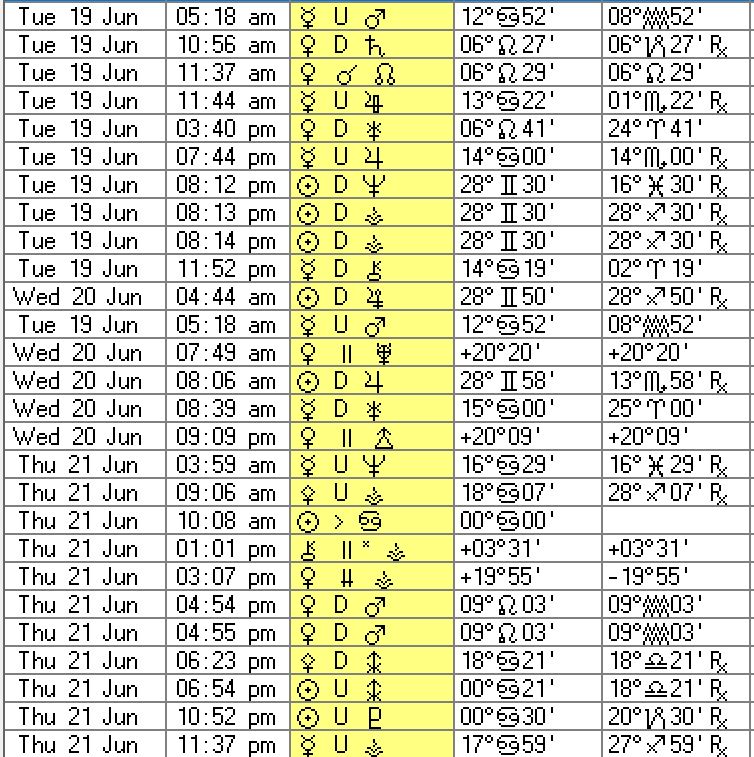
This is a home grown system. 40 years of my life. The movements of the planets to each other, is measured, using my own set of angles, that are then simplified into U's and D's, and symbols for parallel and contra-parallels. To begin with, I compare the angles of Mars, then it is the faster planets. Faster planets' angles change quite a lot, so we have to see if there are moments when there is a focus of aspects. Mars background aspect is used, if there are no faster planets' aspects. These are drawn in colour in the Facebook comments. General comments are placed here. They are not definitive. The Geomagnetic activity has to be used as described in the Facebook page. I have put summaries under each table, for US trading, for Mars and faster planets. Times are GMT.
Mars Table
How to use the Mars table
Just look at the Mars angles, and find the moment your are in. If you see that the next aspect from the time you are looking at is a U, then the markets will be seen in positive mood, and negative if it is a D. It is strong when it is within one degree. You will see a thick red or green at the Facebook comment.

7U 9D
Mars Summary
Mars total aspects are more D than U. But there are more focused D's than U's. That means down pressure. But look at faster planets for confirmations, and Geomagnetics on the day, to make it certain.
How to use the Faster Planet Tables
Look at the time period you are interested in. See if there happens to be at least two similar types of aspects in a two hour period. If so that is strong. It is very strong if you get the faster planets, Mars and Geomagnetic being the same. If you have a hour in which you have no faster planets making aspects, and the next Mars is more than one degree away, and the Geomagnetic are flat, then it will be weak.

Fri 4U 2D Mar 1D

Mon 2U 3D
Tue 1U 0D Mars 2U

Wed 2U 3D Mars 1D
Thu 0U 0D
Fri 2U 2D

Mon 2U 4D

Tue 0U 2D
Wed 1U 0D
Thu 1U 1D

Fri 1U 1D Mars 1D
Mon 1D 0U
Tue 1U 3D
Wed 0U 0D
Thu 1U 3D

Fri 3U 1D

Mon 2U 2D
Tue 1U 1D Mars 1U
Wed 1U 2D

Thu 1U 0D
Fri 0U 0D Mars 1U 1D
Faster Planets Summary
I have looked at the 01:30 pm to 08:00 pm GMT periods for Monday to Friday values, as they are US trading times. As you can see some of them are in bold. There are more D's in bold. That means the down pressures are more. See the Mars table and you can see how strong it could be.
Neptune Tables
Moon and other planets and Sun aspects to Neptune correlate to Oil and other commodities. They have been illusive, as they should, because Neptune is. Nowadays Oil does correlate more to normal planetary aspects above, than to just Neptune. This area of my work is still a work in progress. But it looks like Oil will fall.


Conclusion
After all that counting and analysis, you can see that the planetary count for Mars and faster planets during US hours, has more D's than U's. So in simple plain English, it boils down to a down for the markets, or it will be very difficult to go up. But keep that eye on the Facebook comments, where I put the colours in and give it a little more clarity.
Please visit the Facebook page at the link below to see archives and latest reports.