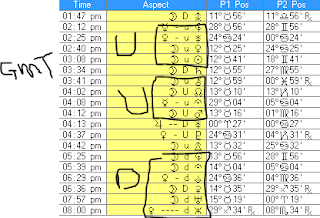
Above is the table of aspect that are more than 80 degrees for the past 5 days. You get much more detail if you had more angles and included the ones made by Moon. But this rough guide still correlates well to the results below, and especially if you compare it to a similar one for last week, or next week. You can then see the big differences. That is only available upon subscription. For now you can see that there are some hards near the end of the day. If you knew what the Moon was doing then you would know exactly what to do as a day trader. But again that info is available upon subscription only.
Correlating and predicting the movement of stock markets, oil prices and sports, to astrology and geomagnetic activity. همبستگی و پیشبینی حرکات بازارهای سهام، قیمت نفت و ورزش، با اخترشناسی و فعالیتهای ژئومغناطیسی.
Friday, June 18, 2010
Friday, June 11, 2010
Free US Stock Market Astrology Report for Thursday 11th June 2010
What I decided to do, was to filter out the weak aspects. These are aspects that are less than 80 degrees. See if that makes a clearer correlation. Happy trading in what looks as a tough ending after some bouyancy midday.
Thursday, June 10, 2010
Free Stock Market Astrology Report for Thursday 10th June 2010
Have a look at this contrast. But see if you can understand the period I have market with question mark. As usual it is all GMT. US is four hours behind GMT, so the market there closes at 8pm GMT.
And below is what actually happened. Going back and looking at the aspects, you can see the close correlation to most of it. The areas where the correlation slips are shown too. And in hindsight you can see that some of the aspects should have been taken more seriously.
So that is why this is not perfect. But it is very interesting, and should be used in the right situations only.
Wednesday, June 09, 2010
Free Stock Market Astrology Report for Wednesday 9 June 2010
This is for the US trading period. US is four hours behind GMT. I have marked clearly when the up and down periods are. Now if the market is going down in the Up period, then it will be difficult for the market to keep going down. And vice-versa. Simple. Test it, and see if it works. It can't be clearer.
And below is the result
It is really quite clear how the correlations worked.
Sunday, June 06, 2010
Why the stock market fell last week (31 May - 4 June 2010)
As you can see there were some Up aspects, and Down aspects, that I have circled, which correlate with the chart of the Dow. These are just Planetary aspects, and the Moon ones have been left out. If you have them, then you can really see the close relationships at 15 mins intervals or less..
Subscribe to:
Comments (Atom)


