Showing posts with label Asteroids. Show all posts

Thursday, October 31, 2019

Stock Market Astrology November 2019

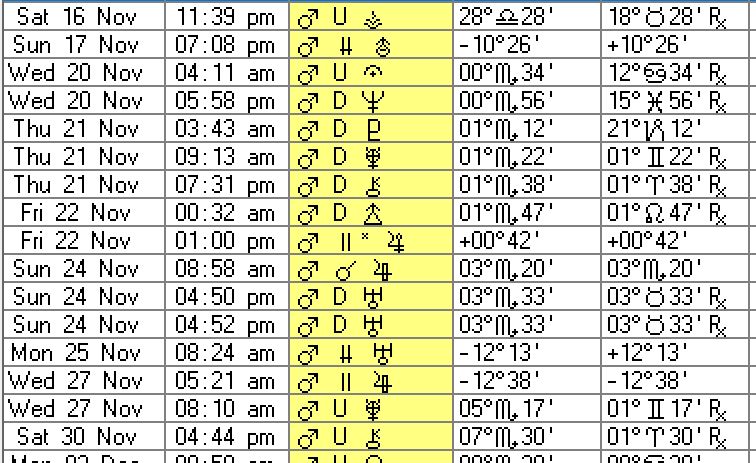
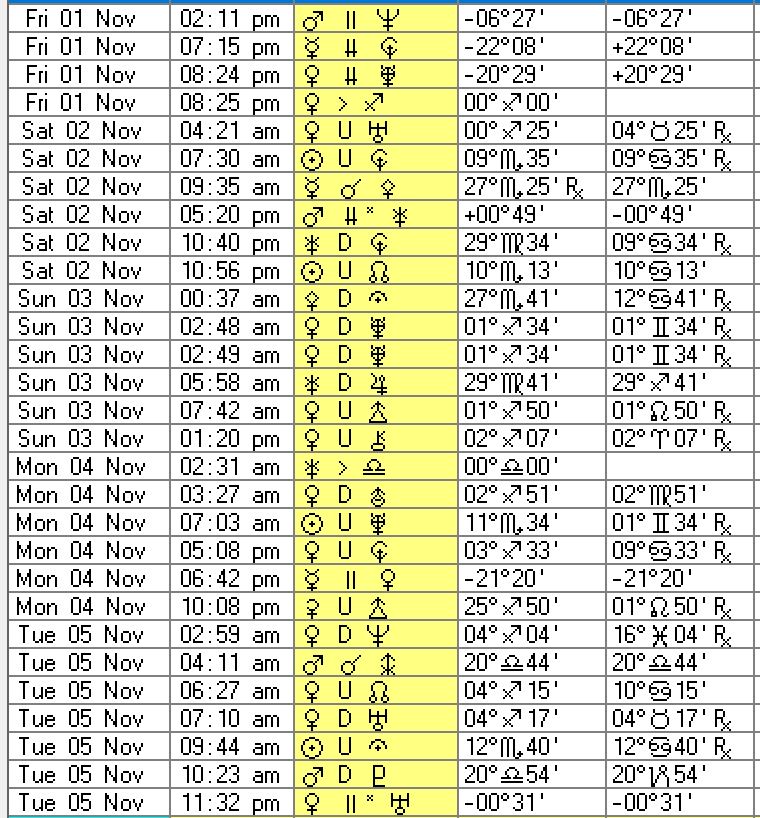
A new report including Asteroid tables has been created. Hopefully in time, these new background concentration levels will give even clearer signals. Please note, that the daily reports are placed in the Facebook comments at this link. A copy appears in the Twitter feed.

ASTEROIDS


MARS


FAST PLANETS


NEPTUNE


Wednesday, January 27, 2010

Asteroids dropped the stock markets 15-22 Jan 2010


Asteroids did effect the markets. Look at the D and d aspects, which made the market go down on 20th and 21st. Chart from Yahoo.

Saturday, October 24, 2009

Market Astrology: Mars and Asteroids for 19-30 Oct 2009

This table was created to see how really useful it could be. The one before was just Mars. This one includes the Asteroids as well. I find the faster entities eg: Venus, Mars, Sun, and Moon, have to be included for looking from one hour to the next, but not in this sort of time period.


Immediately you can see how much more D or d there are for last week. And the same is true for the coming week with the Ds there from 28th. There are a couple of ups on 28th and 29th with a U and a u, but those three downs will give it a sour ending for the week.


Obviously we can get a lot more accurate with the hourly aspects thrown in. Remember all this is for fun, and for goodness sake, don't for one moment think that it works.

Tuesday, February 13, 2007

Sun, Mercury, Venus, Mars and Asteroids vs Dow Jones for 31 Jan to 20 Feb 2007

Above is the chart of the Dow Jones Industrial Average from Wednesday 31 Jan 2007 until Tuesday 12 February 2007. Below are the number of hard and soft aspects of the Sun and the Planets Mercury, Venus, Mars, and four Asteroids Chiron, Vesta, Pallas, and Juno, for the same period and next week. Ignore the dots, that's just to space it all out.

Date.........Hard.....Soft
31/01/2007..5........3
01/02/2007..7........7
02/02/2007..3........5
05/02/2007..5........5
06/02/2007..7........5
07/02/2007..3........6
08/02/2007..5........5
09/02/2007..8........9
12/02/2007..5........5
13/02/2007..1........6
14/02/2007..5........3
15/02/2007..6........6
16/02/2007..3........7
19/02/2007..6........2
20/02/2007..7........3

So what can we expect? As you can see from the chart the flat period correlates somewhat closely with the aspects. The reason that it is not much better is that the aspects take place at an exact time. So not all the aspects are there when US is trading. Also I have not included the Moon's aspects. However one should see the large differences being reflected. And the hard aspects are greater apart from just one day in the days coming along.

If you want a more detailed report, contact me for pricing. Be sure to put "Question for Ali" in the subject field when you send it to aliwhoATgmailDOTcom.

Wednesday, January 10, 2007

Medium speed stellar entities for Oct-Dec '06

Medium speed stellar entities for Mars and the four Asteroids' weekly hard and soft aspects.

2006
Week Hard Soft
2-8 Oct 8 13
9-15 12 7
16-22 10 13
23-29 14 12
30-5 Nov10 8
6-12 5 10
13-19 16 9
20-26 8 11
27-3 Dec15 9
4-10 10 9
11-17 12 14
18-24 15 12
25-31 7 10

Now take a look at the stock markets and you will see that the markets rose as the softer aspects became more. Next week I will show the short term stellar entities, such as Sun, Mercury and Venus.

To summarise then, last week you saw the longer term stellar entities from Jupiter to Poseidon. They showed a rise. This week you can see the particular weeks that superimposed those aspects. Next week you will see the days in the weeks. And the following week you will see how it works from one hour to the next.

Get in touch with me if you need help in finding these results. I charge for any consultation.