
Friday, December 31, 2010
Mars December 2010 to January 2011
Thursday, December 02, 2010
Astrology of US Non-Farm Payroll 3 December 2010

I produce this reports at a cost, and my customers learn how to use them. Contact me on aliwhoATgmail.com.
Thursday, October 14, 2010
Sunspots
The calculations yield a rock-bottom level of 7919 for the DJIA in early 2014, and 12900 billion 2000$ for the GDP in late 2012.
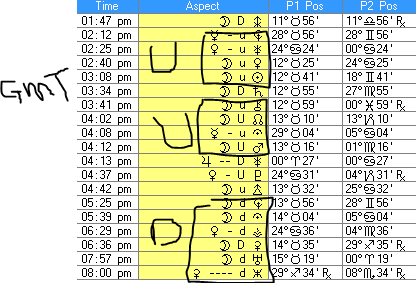
in reference to: www.growth-dynamics.com/articles/sunspots.pdf (view on Google Sidewiki)Example of an intra-day Astrology report for day traders in stock, currency markets

It is not always that you get a good mix of softs (u or U) and hard (d or D) aspects in a day. When they are less than 15 mins apart then I refer to that time period as a focused period. Then the high volume market or stocks move well. There is more to all this, and that is what the detailed reports are all about. Times are GMT.
and below is the result:

Now you can see the power of aspects.
Friday, October 08, 2010
Astrology of US Jobs day Friday 8th October 2010

When I looked at today's Aspectarian show above, I thought with all the tension leading up to the US Jobs data, it is all going to be an anti climax (lots of mixed aspects M). So did not bother to put it up. Now I see it turned out to be just that. We are in the last U as you can see, and so even the figures were bad, the mood of the people is good and they will try to find the good news wherever it is. And that is essentially why markets move the way they do.
and finally as shown below the market did go up with the softs at the end:

Friday, October 01, 2010
Mars in August and September 2010

Have a look at the two tables above. The top one is for August and the one below is for September. We all know that the markets went down in August and up in September. With these reports in advance you would have known that already.
It is not perfect, but with more detailed knowledge from more detailed analysis you would get a lot more accuracy. But simplicity is best. And this is as clear and simple as it gets.
Thursday, September 02, 2010
Astrology of before and after Non Farm Payroll Day in USA 2-3 September 2010

Above is the complete list of aspects from now until tomorrow. U's mean soft aspects focus, and D's mean hard aspect focus. As you can see we have some interesting periods. This time we have the all famous US stats coming tomorrow 3 Sept at 12:30 GMT which is in the middle of a D. These are the tables I produce but with explanations which are designed to teach the beginners. Email me on aliwho@gmail.com for my services.
Tuesday, August 17, 2010
Free Stock Market Astrology Report for 16-20 August 2010

Wednesday, August 11, 2010

Thursday, August 05, 2010
Free Stock Market Astrology Report for Friday 6th August 2010

Above is the table of aspects for Friday 5th August 2010. The times are in GMT. So the the all important US unemployment figures will be announced at 12:30 GMT. The aspects are hard in that period until 02:42 GMT or 10:42 EDT. But from then on until 04:09 PM GMT or 12:09 EDT the aspects will be soft. The it will get weak either way and you can see the times yourself, until the close when the hards have the way.
So looking at the non-lunar aspects, as the weekly report shows, is fairly good, but one needs to look at the lunar aspects as well.
Tuesday, August 03, 2010
Free Stock Market Astrology Report for 2-6 August 2010

I am not going to explain the table only to say that it is in GMT. Write to me if you need help.
Wednesday, July 28, 2010
Astrology vs Economics: compare the prediction and see the results for 19-30 Jul 2010

Table 1

Table 2

Table 3
Above you have three tables. Table one and two are my simplified tables of the positions of the various planets with up and down summaries for last week (table 1) and this week (table 2). Table 3 is what all the high flying economists look at, and gamble on.
Last week's prediction as shown in Table 1 clearly indicated and predicted the markets. This week's is given in Table 2 for free, right here for you to see.
Watch this space.
Thursday, July 15, 2010
Free Stock Market Astrology Report for Friday 16th July 2010

This is the sort of result you get when all the aspects for everything is shown. All I have done is to simplify things. Let's see if the market dances to the stars!
Free Stock Market Astrology Report for Thursday 15th July 2010

I showed in the previous message why we went up in the markets. Rest of this week is given for free. You do need the minute by minute aspects to really get the day trading timing right. Those can be purchased. Contact me on aliwhoATgmail.com.
Market Astrology: Why we have moved up recently in the markets (July 2010).


Above are tables showing the planets' aspects that are strongest, either because they are soft or because they are hard. You can see the periods when there are a lot of U's or D's. That means we have a focus of aspects. Now we all have just witnessed a good 7 days of some 7% move up in this 7th month of the year. If you look at the aspects you will see that there are more U's at the moment, compared to last month.
These tables can be created for any time. So as you can imagine I can produce the ones for next week, and so on. It is not perfect, but there is nothing out there that beats it.
Friday, June 18, 2010
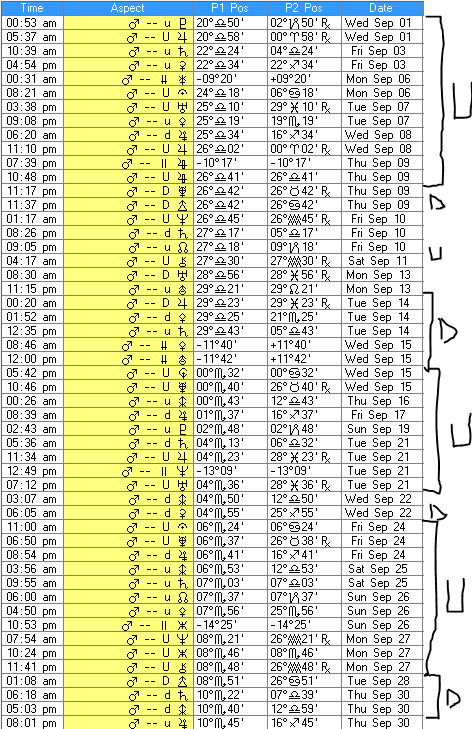
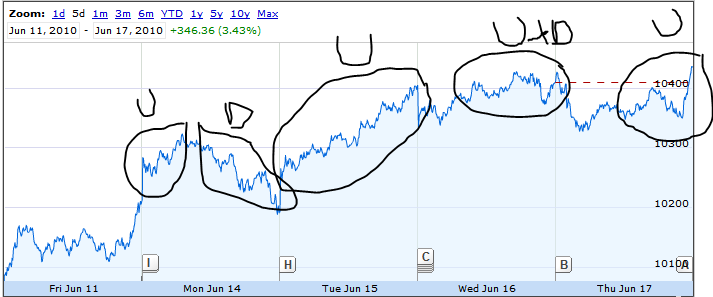
Free US Stock Market Astrology Report for Friday 18th June 2010

Above is the table of aspect that are more than 80 degrees for the past 5 days. You get much more detail if you had more angles and included the ones made by Moon. But this rough guide still correlates well to the results below, and especially if you compare it to a similar one for last week, or next week. You can then see the big differences. That is only available upon subscription. For now you can see that there are some hards near the end of the day. If you knew what the Moon was doing then you would know exactly what to do as a day trader. But again that info is available upon subscription only.
Friday, June 11, 2010
Free US Stock Market Astrology Report for Thursday 11th June 2010

What I decided to do, was to filter out the weak aspects. These are aspects that are less than 80 degrees. See if that makes a clearer correlation. Happy trading in what looks as a tough ending after some bouyancy midday.
Thursday, June 10, 2010
Free Stock Market Astrology Report for Thursday 10th June 2010

Have a look at this contrast. But see if you can understand the period I have market with question mark. As usual it is all GMT. US is four hours behind GMT, so the market there closes at 8pm GMT.
And below is what actually happened. Going back and looking at the aspects, you can see the close correlation to most of it. The areas where the correlation slips are shown too. And in hindsight you can see that some of the aspects should have been taken more seriously.

So that is why this is not perfect. But it is very interesting, and should be used in the right situations only.
Wednesday, June 09, 2010
Free Stock Market Astrology Report for Wednesday 9 June 2010
This is for the US trading period. US is four hours behind GMT. I have marked clearly when the up and down periods are. Now if the market is going down in the Up period, then it will be difficult for the market to keep going down. And vice-versa. Simple. Test it, and see if it works. It can't be clearer.
And below is the result

It is really quite clear how the correlations worked.
Sunday, June 06, 2010
Why the stock market fell last week (31 May - 4 June 2010)


Sunday, May 23, 2010
Astrology for 24-28 May 2010 - Fast Planets

I am calling it fast planets, because I am looking at Mercury, Venus, Sun, Mars versus the others this week. As you can see the number of D's and d's is everywhere apart from around the 26th, where you see U's and u's. But you cannot generalise that easily. You need to look at the Lunar aspects as well to get the minute by minute trading right. As I have said, if we have a period when you get a decent set of Lunar aspects, and that they are the same as the up coming planetary aspect, then there are good reasons to get some decent correlations. If not, then we have to follow the fast planets. For explanations you need to have a one-on-one with me at a cost.
Wednesday, May 19, 2010
Free Market Astrology Lesson for Wednesday 19 May 2010

There are U's, u's, and D's, and d's today. Look at the GMT times they occur together and we should see some wild gyrations. But as a simplification the non-lunar ones look to have more hard aspects, even though we do have soft ones. So a mixed bag really.
Thursday, May 13, 2010
Free Market Astrology Lesson for Thursday 13 May 2010

Friday, April 16, 2010
Goldman Sachs Free Market Astrology: Sun to Mars for 16-17 April 2010

Sometimes you look at events, announcements, and you try to see if the stellar aspects will effect it. Let's take the dive on Wall Street with regard to the Goldman Sachs.
Now put these two concepts together, and you get what many call Horary Astrology. I am not strictly going by Horary rules here, but a lot of this applies.
So what is the bottom line. Lots of D and d as you can see. Obviously we need the lunar aspects, and all of the other exact aspects to have the complete picture, as you saw on Wednesday.
Tuesday, April 13, 2010
Free Market Astrology Lesson for Wednesday 14 April 2010

01:30 pm-02:07 pm U and u means easier to go up. No real focus, so not strong.
02:53 pm-06:29 pm mostly D, again no focus, so not strong.
07:06 pm-08:04 pm mostly u and U, good focus, so strong.
This report is free, and use it against anything you wish. The applications are as diverse as life itself.
Friday, April 02, 2010
Mars Jan to March 2010


Above are images of a software I use to generate what are called Aspectarians. I was over at an Astrology forum today, where I was rather surprised to find how unaware some people are. So for the sake of truth, look and learn. I have made it really easy. Look at the number of U or u (for up forces) and D or d (for down forces). These are exact aspects, so anyone should be able to recreate them. You will see why the markets have moved the way they have. I cannot codify all the aspects to Us and Ds.
Of course there are even more accurate minute by minute tables as well. But good old Mars has been forecasting the big moves for thousands of years.
Wednesday, March 31, 2010
Free Market Astrology Lesson for Wednesday 31 March 2010

Look the box at 05:20pm where there is a picture of a Moon followed by a D and then the picture of Mars (circle with an arrow). Now look below it and you will see more Ds than Us. That is my way of simplyfing the angles the stellar entities are making now and in the near future in GMT. More Ds means more hard aspects.
Tuesday, March 02, 2010

Tuesday, February 23, 2010
Free Market Astrology Lesson for Wednesday 24 February 2010
 I was looking at tomorrow's chart, and noticed it was pretty concentrated in Ds. I thought maybe I should put it early.
Tuesday, February 16, 2010
Market Astrology: Comparing Hourly Aspectarians

 Look at the two aspectarians above. It is pretty clear why the markets went up yesterday. Just count the number of U and u, compared to D and d. Look at their concentrations, that means how many per unit time.
It is not rocket science.
Wednesday, January 27, 2010
Asteroids dropped the stock markets 15-22 Jan 2010

 Asteroids did effect the markets. Look at the D and d aspects, which made the market go down on 20th and 21st. Chart from Yahoo.
Tuesday, January 12, 2010
Mars Aspects for Oct-Dec 2009
 Above is a free table of Mars vs all the slower stellar entities for the past three months. You should be able to see the relationships to the markets you are using. It works best with high volume markets like currencies and index futures.
Subscribe to:
Posts (Atom)
-
Premium service with lessons from now on, from this contact form link: Contact Form Please make sure you are satisfied, with the free end of...
-
Citystats Stock Market and Oil Astrology 1-9 November 2024. Premium service with lessons from now on, from this contact form link: https://d...
-
Premium service with lessons from now on, from this contact form link: Contact Form Please make sure you are satisfied, with the free end of...
