Monday, July 23, 2012

Astrology of the Stock Market 23 July to 03 August 2012

Astrology of the Stock Market 23 July to 03 August 2012

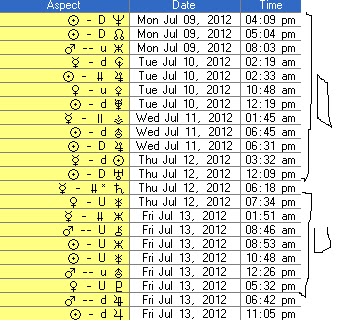
Above are the aspects of the planets, very neatly I must add, shown for all to see. It is self explanatory and intuitive.

Look at this week, and you see lots of Ds. We had a taste of this wave today with 2% falls.

Next week is mixed by comparison.

It is that clear. Want to see weeks in advance then contact me for prices.

It can be more accurate and hourly if we add the Moon aspects.


Monday, July 16, 2012

Astrology of the Stock Market - Moon major aspects 16-17 July 2012

Ok folks, you old timers will know this old favourite of mine.  Yes sir, it is the major Moon aspects. What I have done is to filter out any aspect that it is 80 degrees or more. Next, I have found the periods when we have a load of Us or Ds.

Now, have a look at the previous report on the planets, and see the moments when we have Us and Ds in both the Moon table and the planet table.

Some people just look at Moon tables. What I do, is use exact aspects and it is GMT. I know it is just two days. But I am here to wet your appetite. Get in touch if you want to buy data like this for any time you wish.

You traders might just find a really cool link to your markets. See if the markets turn at particular times. Who knows you might just find a link for your strategy.

Wednesday, July 11, 2012

Astrology of the Stock Market 2-20 July 2012


Sorry folks, been away for a while and did not update this blog. Above are three images of this week last and next week.

The method employed is consistent. It is up to you to see whether there is a correlation to your particular market or whatever it is you are looking at.

It can be something other than markets.  It could be your own mood.  All that is certain is that the patterns shown above are for moments when there is or there is no concentration of soft or hard aspects.

A U is when you have that period when the aspects are soft.  A D is when they are hard.

I can explain more and give you this sort of an output for any time in history. Write to me to find out.