The calculations yield a rock-bottom level of 7919 for the DJIA in early 2014, and 12900 billion 2000$ for the GDP in late 2012.
in reference to: www.growth-dynamics.com/articles/sunspots.pdf (view on Google Sidewiki)Thursday, October 14, 2010
Example of an intra-day Astrology report for day traders in stock, currency markets

It is not always that you get a good mix of softs (u or U) and hard (d or D) aspects in a day. When they are less than 15 mins apart then I refer to that time period as a focused period. Then the high volume market or stocks move well. There is more to all this, and that is what the detailed reports are all about. Times are GMT.
and below is the result:

Now you can see the power of aspects.
Friday, October 08, 2010
Astrology of US Jobs day Friday 8th October 2010

When I looked at today's Aspectarian show above, I thought with all the tension leading up to the US Jobs data, it is all going to be an anti climax (lots of mixed aspects M). So did not bother to put it up. Now I see it turned out to be just that. We are in the last U as you can see, and so even the figures were bad, the mood of the people is good and they will try to find the good news wherever it is. And that is essentially why markets move the way they do.
and finally as shown below the market did go up with the softs at the end:

Friday, October 01, 2010
Mars in August and September 2010

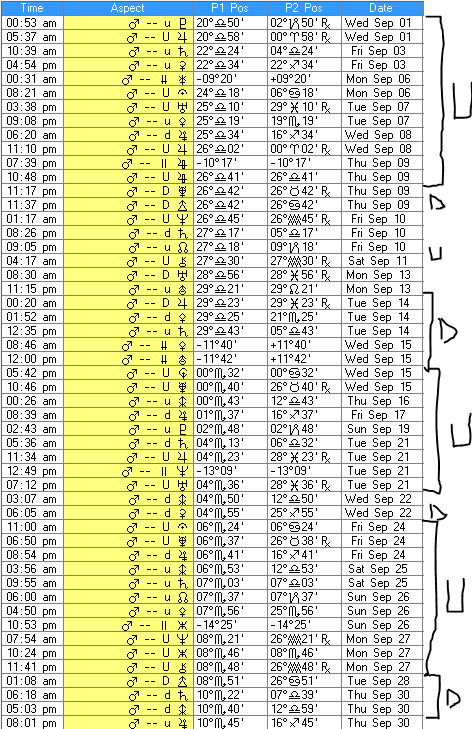
Have a look at the two tables above. The top one is for August and the one below is for September. We all know that the markets went down in August and up in September. With these reports in advance you would have known that already.
It is not perfect, but with more detailed knowledge from more detailed analysis you would get a lot more accuracy. But simplicity is best. And this is as clear and simple as it gets.
Subscribe to:
Posts (Atom)
-
Premium service with lessons from now on, from this contact form link: Contact Form Please make sure you are satisfied, with the free end of...
-
Citystats Stock Market and Oil Astrology 1-9 November 2024. Premium service with lessons from now on, from this contact form link: https://d...
-
I usually post free aspects on Wednesdays, but I was not feeling too well - been having a surgery, and so I am posting some today. You can ...
