Review of Stock Market Astrology Report for February 2018
It is hard to imagine a more perfect correlation. To prove the point, I decided to post daily reports and clarify the prediction for every day that is written here, in the Facebook comments. The correlations were surprisingly good. This just does not happen. Normally I get it completely wrong. So this technique is working. I will then continue to use this technique. My objective is to clarify and teach. Obviously the fact that I share openly, is giving me the correct inspiration. A big thanks to Facebook for making all this happen.
Stock Market Astrology Report for March 2018
Introduction
About me
If this is your first time here, then read this. I began as a broker in 1980's at what was Merrill Lynch. One day I read about WD Gann and noticed that he had a copy of an Ephemeris on his bedside table. It was taboo in those days, before the great 1929 crash, to speak of Astrology, let alone something as "absurd" as stock market astrology. He has made more money than anyone else in the history of markets. Why? Because he got it always right. I then met a stock market astrologer, and the person would not share their work. My task became clear. I found that, all that great education I had from all the best schools and universities, all taught me how do research with integrity. Being a "big mouth" and "loud", with a lot of passion, I felt that I could use it to promote this subject. I was born at exactly the time of the Full Moon in January 1957. I knew, I had to be able to create a system, that would be bold and different, and be able to be take on and beat the best out there. I knew I would get laughed at, but the system I will devise will survive. And it has. It has been hard work, with a lot of mistakes, but it has improved. I work on my own, and it is a labour of love, as I thrive on difficulties and errors, constantly editing.
About the tables and the history
I look at the angles (or as Astrologers call them, aspects) between planets. It is pure maths and trigonometry. If you have two objects opposite each other, you have tension, and if two objects are 120 degrees, it is easier. There are a number of other aspects. That is not easily explained. So I have categorised them in U's and D's. U means it is an easy time and a market like Dow Jones goes up in U's and down in D's. But then you have times when there are none of the aspects that are important. So you need to look at the background aspect. What is a background aspect? If you know nothing about planets you will know that the aspects take longer for Mars to take place than for those planets closer to the Sun. So first look at Mars table then the other tables. You will see me write about it in the Facebook comments. I look at the number of aspects in PM EU and US trading. The times are GMT. If I see an important day I put it in bold. You can see the days when there are a lot of U's, and know right away that the market will go up. And the opposite for D's. It is even more when Mars is doing the same. You should look at the products you use and find your correlation. I use it to look at human and animal behaviour in every day life. I can literally tell, that when there are a lot of U's, I will be able to sell products to someone. I can get philosophical about it and go on about U's being an expansive force at that time, and positivism, and D's is the opposite. Yes, ancient Iranians I call Ahuramazdans knew this and I write about it on my other blogs. So this system is very old. I will not say more about that here. But you need to know where my roots are.
Mars Tables for March 2018

10 U 11D
If you look at the whole month the number of U's and D's are balanced. But look for periods, when you have two or three U's, or two of three D's together. The first half of March has more U's first in focus than D's, with three of them. The second half of the month has less focused aspects with two of them for both U's and D's. Now the trick is to see whether at the period when we have three U's, the faster planets are doing the same thing. If you do, you will get a very big move. That is what crashed the market in February. So look at the tables below next.
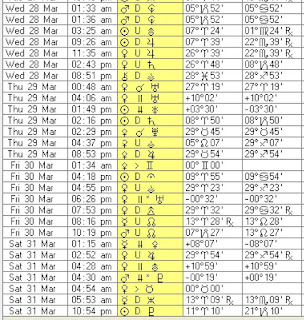
Mercury, Venus, Sun Tables for March 2018

Thu 6U 2D
Fri 3U 1D

Mon 0U 2D

Tue 5U 2D
Wed 1U 1D
Thu 2U 1D

Fri 2U 4D

Mon 2U 2D
Tues 2U 2D
Wed 1U 3D
Thu 2U 3D

Fri 2U 4D
Mon 0U 2D

Tues 2U 1D
Wed 0U 0D
Thu 0U 4D
Fri 1U 2D

Mon 1U 3D
Tues 5U 0D

Wed 1U 1D
Thu 2U 3D
Fri 4U 2D
It is very easy to count the number of U's versus the number of D's. You can see we have more D's than U's. Having said that we have some days with massive U's.
Neptune Tables for March 2018


I also look at the angles made by Moon and planets to Neptune for oil. It is also a useful table for getting the exact times when the Moon and planets change sign. It is only good when there are a lot of U's or D's very focused for a long time, during the trading week. It looks as if we have we have more D's. So oil will be pressured.
Conclusion
Okay, you are reading this bit because all the above is too complicated with Astrology "mumbo jumbo". You want the "bottom line". The bottom line is down. There are more D's, apart from the first and the last day of the month. It is that simple. I hope will visit the Facebook comments page for daily reports and analysis.
