

The method employed is consistent. It is up to you to see whether there is a correlation to your particular market or whatever it is you are looking at.
It can be something other than markets. It could be your own mood. All that is certain is that the patterns shown above are for moments when there is or there is no concentration of soft or hard aspects.
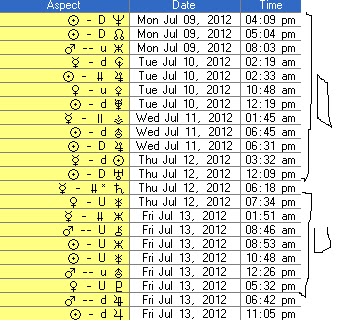
A U is when you have that period when the aspects are soft. A D is when they are hard.
I can explain more and give you this sort of an output for any time in history. Write to me to find out.